At the Hikma investor day at the end of last year, CEO Siggi Olafsson made in interesting observation on the company’s R&D productivity. Noting that Hikma was putting 7% of its turnover into R&D but that the sales from newly-launched products in H1 2018 were only 4% of total revenues, he said that he had told his team that they should be aiming to generate a higher percentage of sales each year from new products than the % R&D spend – ideally closer to 10%. Superficially, it seems reasonable enough to aim to get more money out of R&D than you put in, but – other than a way to push the scientists and BD team to make more effort – does it actually make any sense in practice to set this as a target?
In pure numerical terms, the answer to this is clearly ‘no’, even if you overlook the very basic point that research spending today leads to income years in the future and hence that this year’s launch revenues are totally unconnected to this year’s R&D expenditure. Imagine a business with sales of £100m that spends 10% of its turnover on R&D, the impact of which is to deliver £10m of additional sales in the first year of launch. If the underlying business is growing, the new launches will be responsible for less than 10% of total turnover and the scientists will have missed their target. If the core business is shrinking, on the other hand, it will be a big win for the R&D department as they over-achieve their goal by delivering more than 10% of turnover. But which of the two scenarios would you rather have if you are CEO? Or even in the R&D department?
There is also a big question mark over whether the first year of sales is really the best point to take a measurement for all products. For a commodity generic in an unbranded market, certainly, since the bulk of sales tend to come in the first few months. But in branded markets, or with complex generics that are not necessarily substitutable, sales are likely to build up much more slowly and the first year may not be representative of the product’s true potential.
We note that Hikma’s overall operating cash flow generation is around 20% of sales, so assuming that new products also deliver this average, achieving a level of year one sales (and subsequent years also, presumably) equivalent to the (original) R&D spend is effectively asking for a five-year payback period. For commodity products, this is not actually that aggressive – three years would be more normal – but since Hikma operates in a lot of branded markets it seems a reasonable starting point and in any case its absolute R&D spending has risen rapidly over the years as the business has grown.
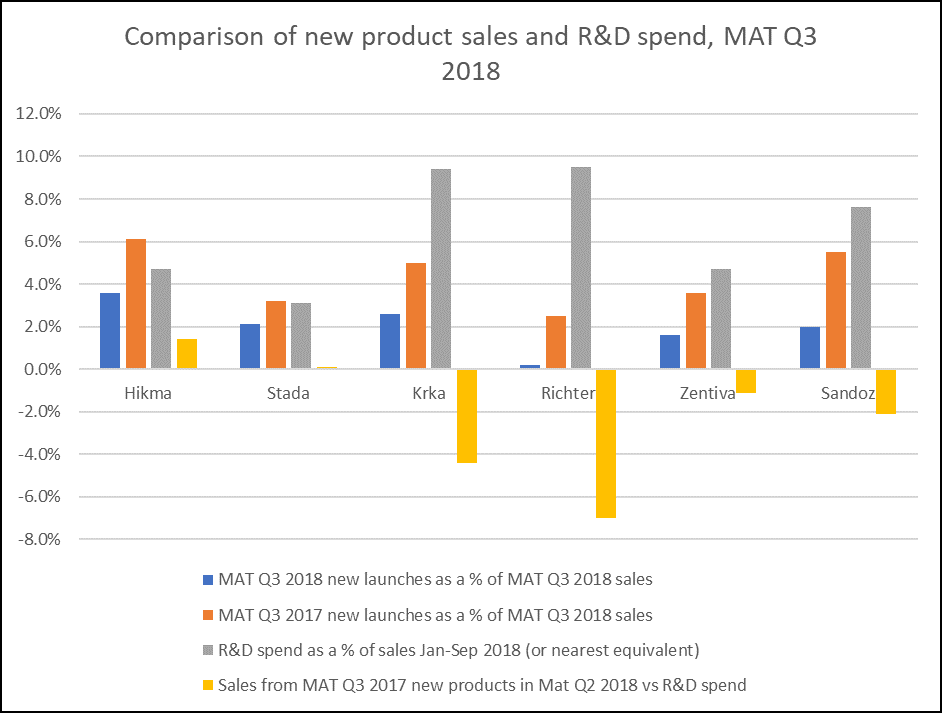
Using IQVIA data, we have analysed the 2018 new product contribution for both Hikma and a set of its peers, to see how Hikma’s own performance stacks up against others. For this, we have totalled the MAT Q3 2018 sales of products launched in MAT Q3 2017 (to make sure that we capture a full year of revenue for each product) and then expressed this as a percentage of total MAT Q3 2018 sales. Where the data is available, we have also compared this with the company’s R&D spend as a % of sales. Obviously, this is just a snapshot and is inevitably influenced by things such as Paragraph IV launches in the US and the fact that IQVIA over-estimates the value of sales in some markets more than others, but we can nevertheless draw some conclusions.
The first of these is that Siggi is being somewhat harsh on his own R&D team. According to IQVIA, sales of products launched by Hikma in MAT Q3 2018 accounted for 3.6% of sales in that year, much as he stated, but when we look at the contribution of products launched the previous year and thus included for the full year to September 2018, they represented 6.1% of total revenue – actually above the H1 2018 R&D spend of 4.7% of sales. R&D spending was down from Hikma’s historic average, however – it was 6.7% in H1 2017, hence the 7% quoted by Siggi – so on this basis there was a slight deficit between spending and returns. The second conclusion is that compared to its peer group, Hikma is a shining star. The only company to show greater sales from new products than R&D spend was Stada, which has historically spent very little on R&D as it tends to in-license a large proportion of its products, the cost of which is not fully reflected in its figures. All the other peers (we excluded Teva and Mylan from this analysis as both of them now have large non-generic businesses that distort the picture) spent more on R&D as a % of sales than they generated in new product revenues – vastly more, in the case of Richter and Krka. It is important to note that both Richter and Krka also spend a lot more on R&D to begin with, at least in part because they develop most of their new products in-house and also expense 100% of their costs through the P&L. Conversely, like Stada, Hikma relies a lot more in in-licensing, but in its case mainly of innovator products that it distributes in MENA. Nevertheless, Hikma comes off pretty well from the comparison and would look even better if we compared the absolute R&D spend at the time at which the launched products were actually developed.
Of course, coming back to our imagined example, the faster a business is growing, the more unfair it is to measure current, rather than historic, R&D spending against today’s income. Hikma has doubled its sales roughly every four years while its peers have grown much more slowly in recent times (or not at all, in some cases), making Siggi’s target particularly challenging to meet. This will make it all the more impressive if he can pull it off and in the meantime, the CEOs of some of his competitors might want to take a harder look at the efficiency of their own R&D departments.